NT1066 Florea review
A couple of days ago we’ve received our prototype board, which may be one of the first commercially sold evaluation kits for this chip. At first, I’ll briefly review the chip and the board, then we’ll discuss the internal design features and compare it with its predecessor, the NT1065.
NT1066
Let’s take another look at the schematic of the chip:
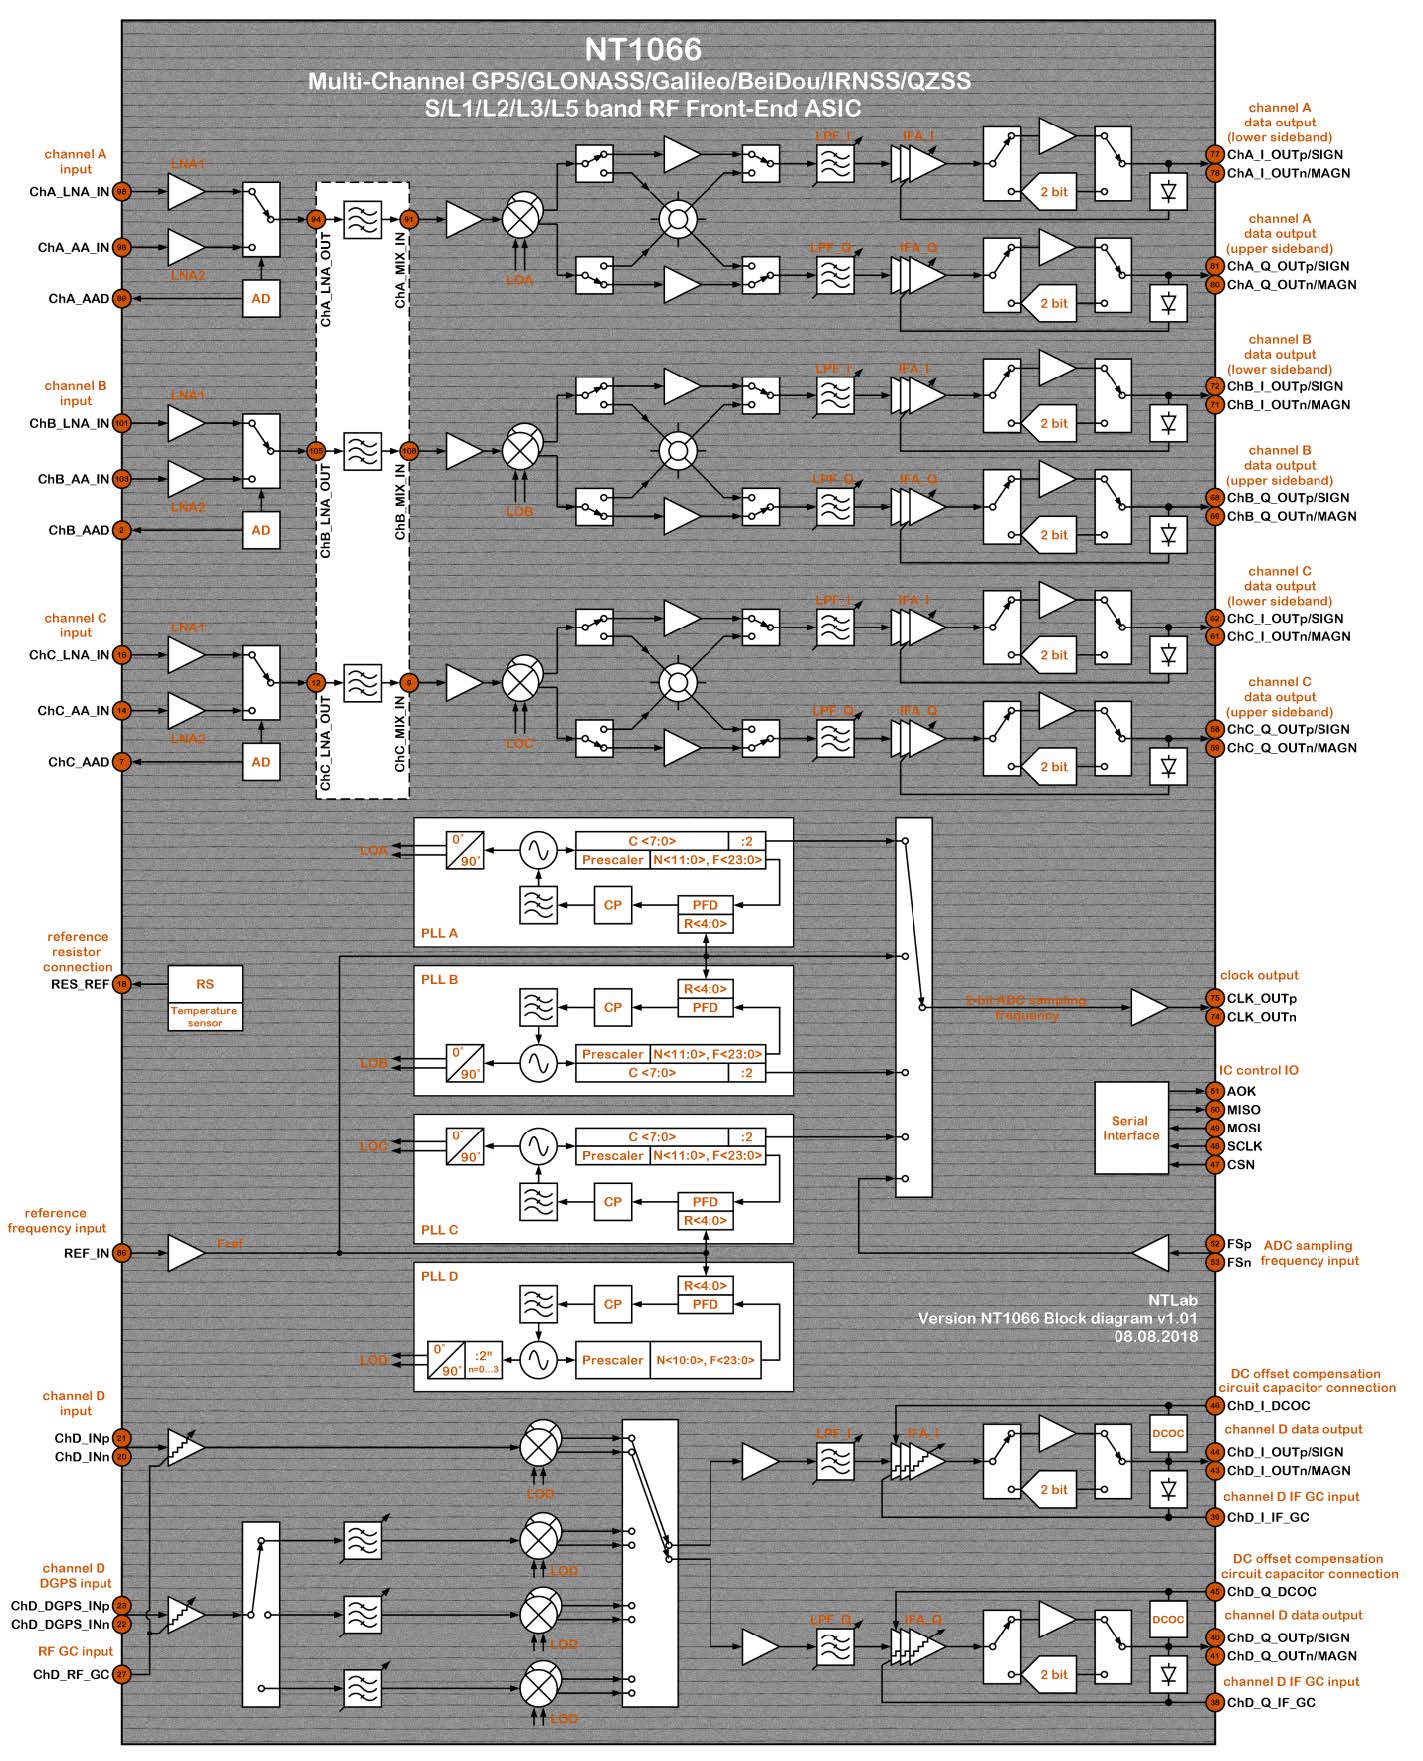
It’s more complex than the NT1065, and the key features are:
- Built-in low-noise amplifiers (LNA) with active antenna circuit, which will allow to significantly simplify the receivers’ design;
- Three wideband channels and a narrowband one. Narrowband is similar to the ones you may find in the NT1065, wideband ones are much more powerful. One of the key advantages is the possibility of the I/Q output, we’ll get back to this later on;
- Four independent LOs with both integer- and fractional-N PLLs. The only drawback here, in my opinion, is the limited frequency range you may set (1160 — 1300 MHz and 1550 — 1615 MHz for the wideband channels).
- Built-in 2-bit ADC with the possibility to work with the external clock.
- Logic is being controlled via SPI.
Evaluation board and the GUI application
The evaluation kit consists of the board with the NT1065 itself, tiny Atmel MCU and a sophisticated reference clock circuit.
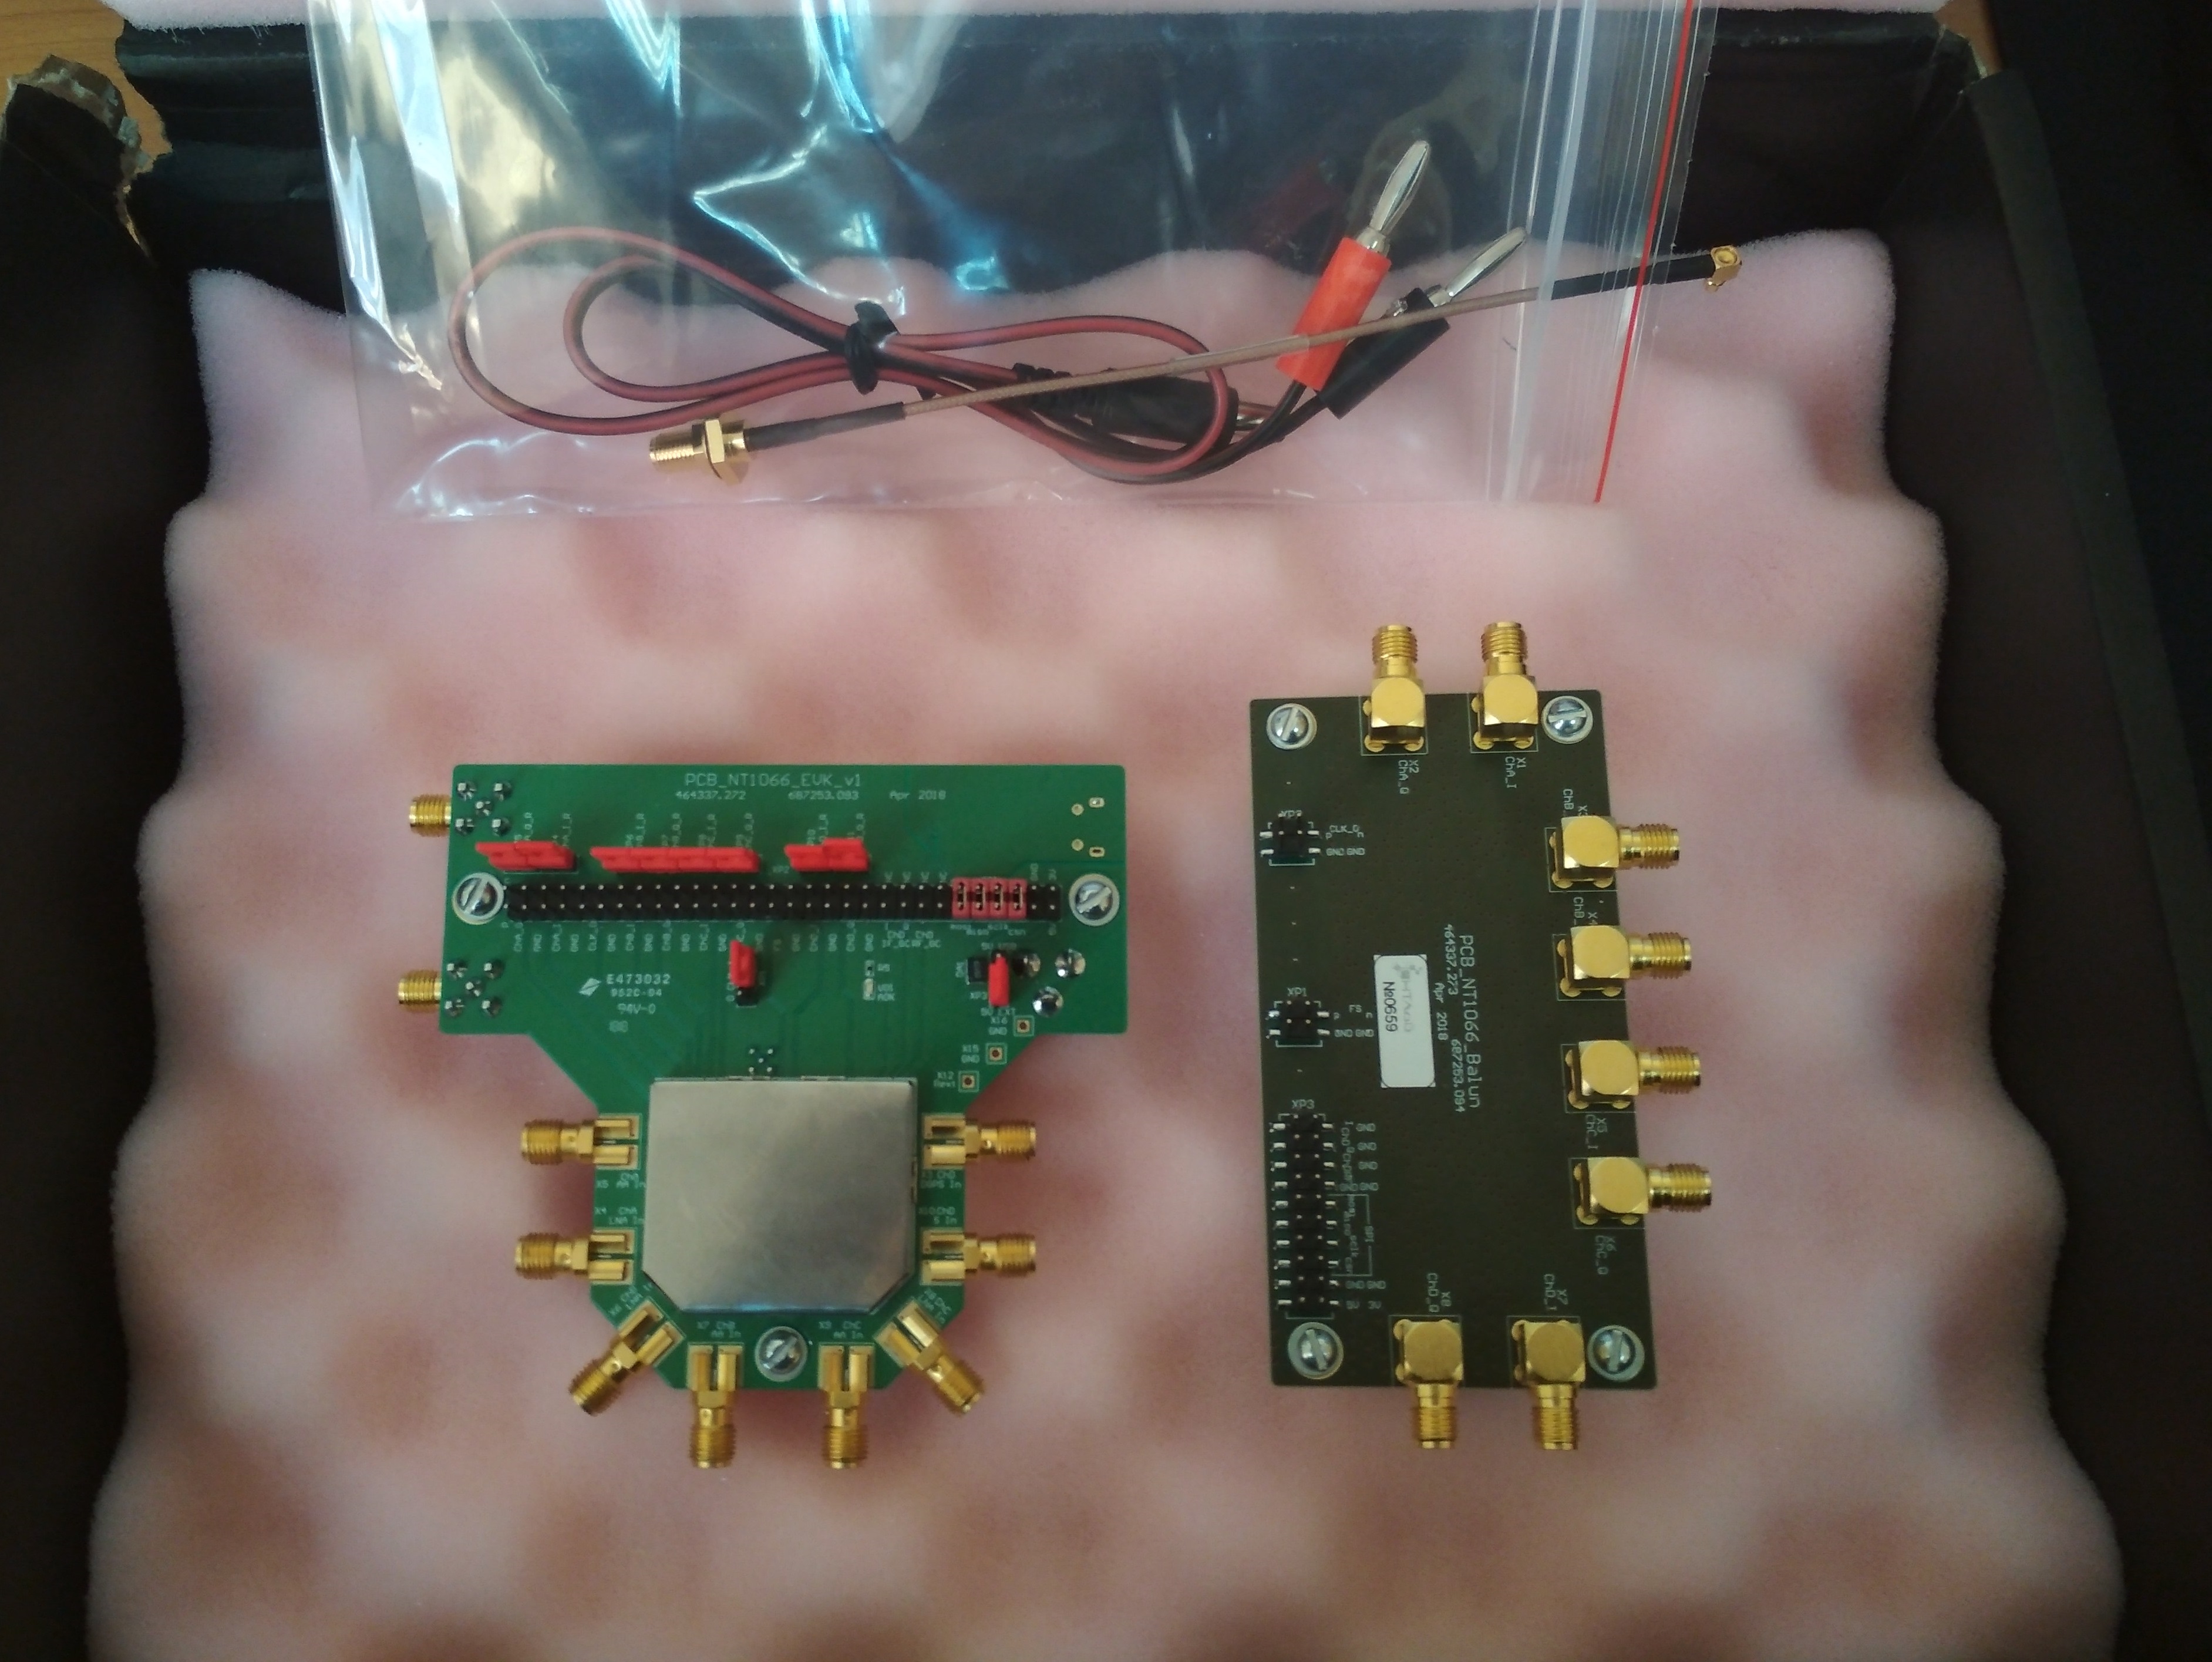
There’s also an extension board to make the evaluation experience more user-friendly and provides the balun-conversion to the SMA connectors. One should also bear in mind that transformers are used to perform this conversion and affect the frequency response quite heavily in lower (<1 MHz) and higher (>100 MHz) frequencies.
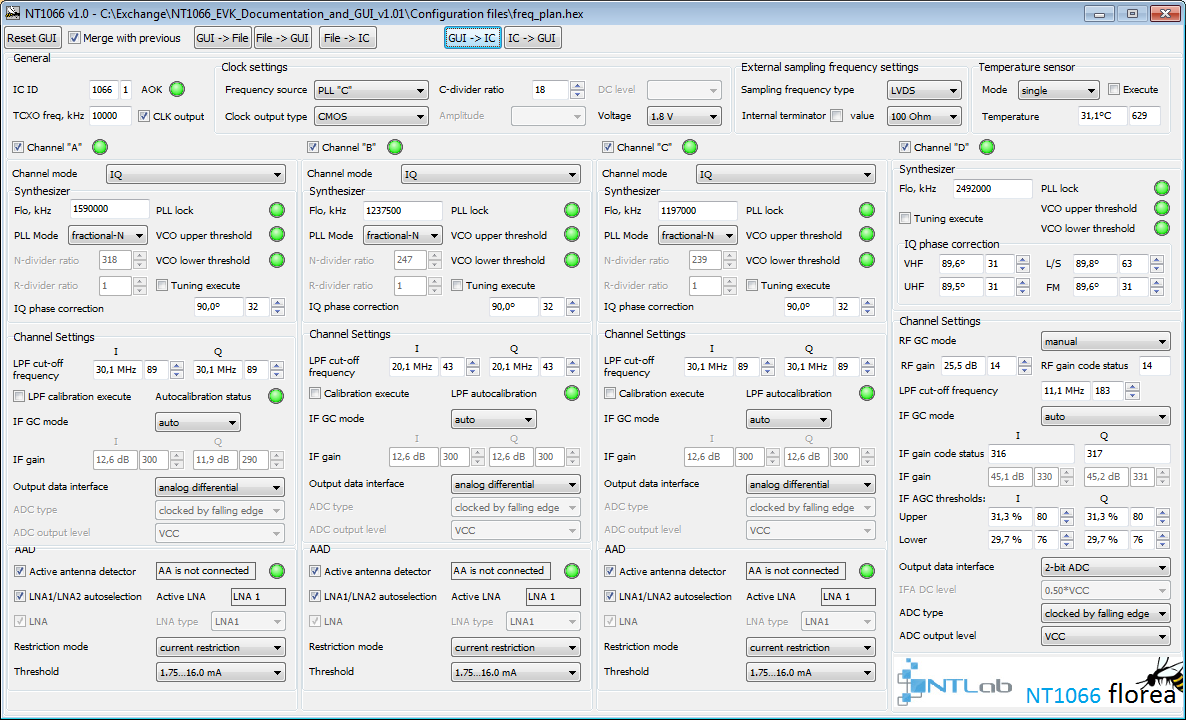
The setup software is similar to the one used for the NT1065. Bear in mind, that it is impossible to run both applications for the NT1065 and NT1066 simultaneously.
Frequency response
UPDATE: As pointed out by Andrei, the NTLab employee, the frequency response of the evaluation board is heavily affected by the SAW filters. I misread the schematic and thought that there are inputs both before and after the filters (LNA_IN and MIX_IN). Therefore, the following frequency responses do not represent the LPF of the frontend, but the combination of the LPF and the SAW filter.
Now comes the interesting part. When I was reading the documentation for the first time, low-pass filters’ frequency response looked quite strange to me. The passband was too wide.
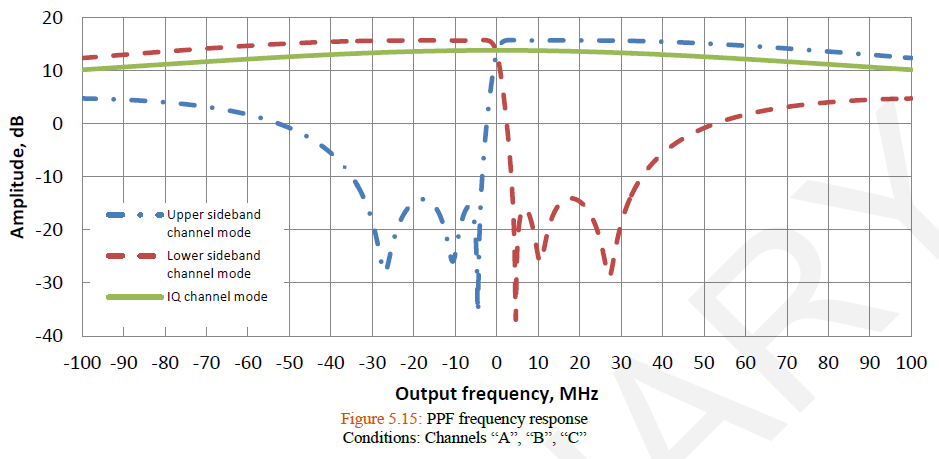
In the latest (0.5) version, NTLab has corrected the corresponding page and now we have something more plausible. One thing that rather disappoints me is the zero-frequency cut, which will become a constraint for some frequency plans.
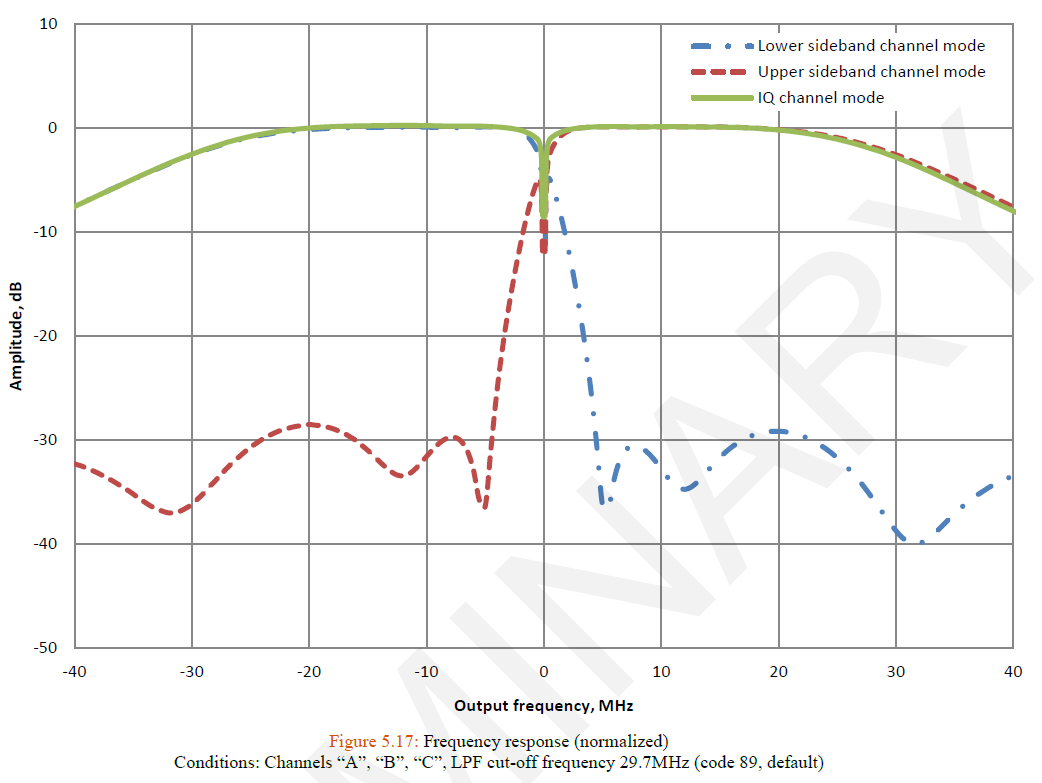
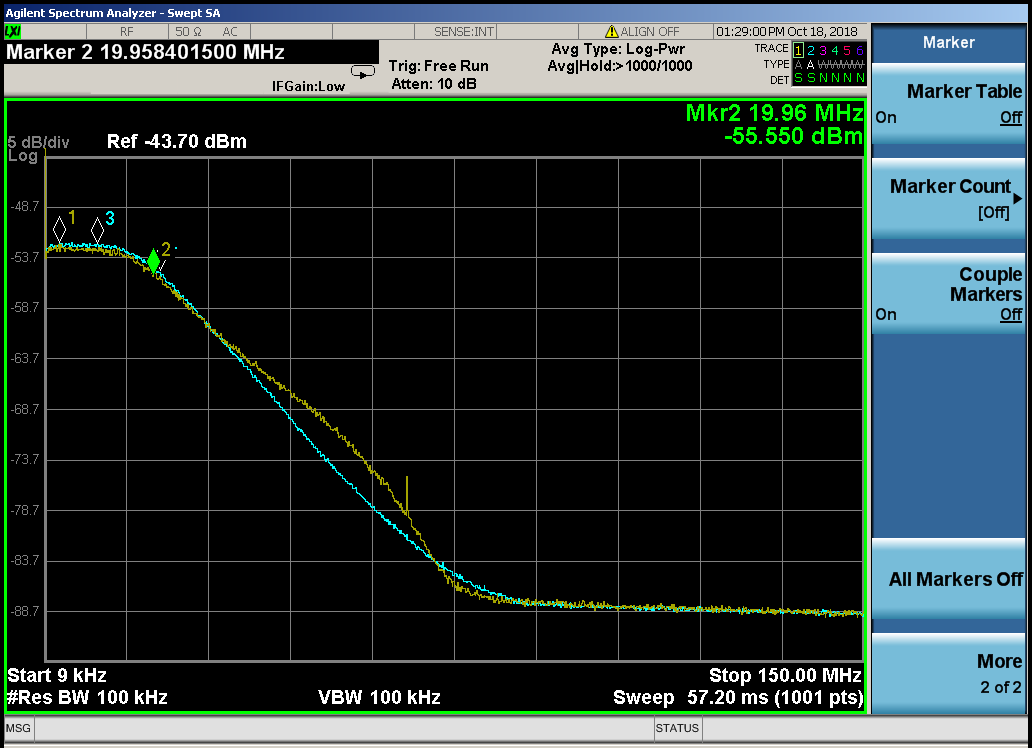
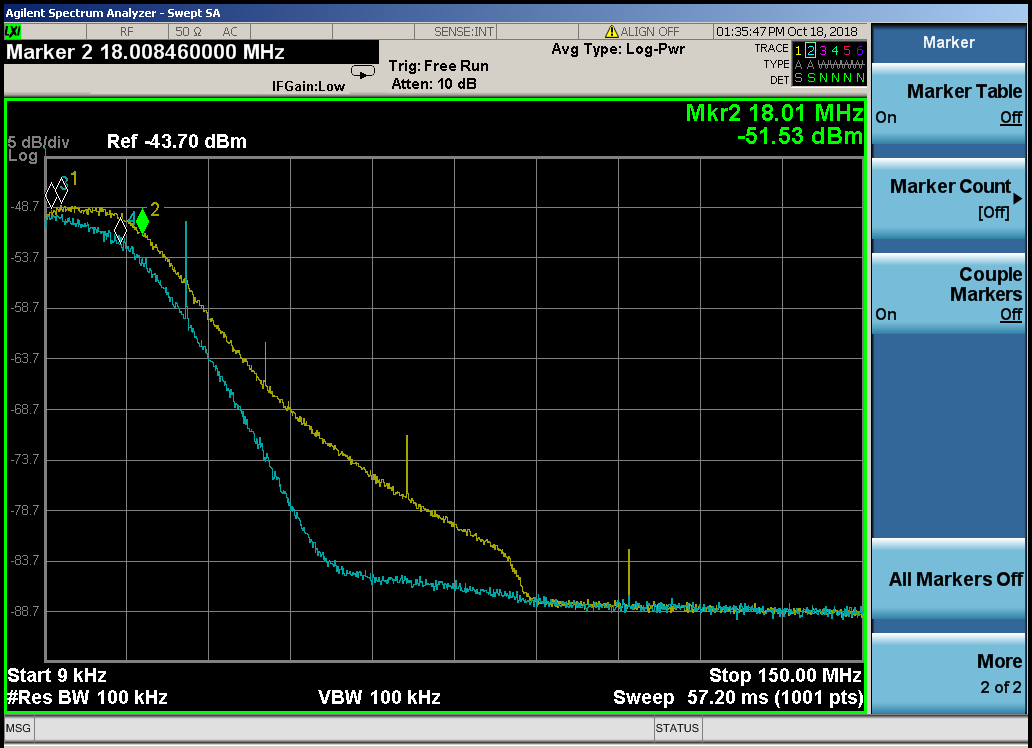
Although I’ve discovered that the filter isn’t symmetrical for the upper and lower sideband. To measure it I’ve used the output mode in which lower and upper sidebands are separated. The yellow line represents the lower sideband, the blue one is the upper one.
For the record:
As the input signal, I’ve used the AWGN from the vector signal generator with the bandwidth of 160 MHz and the carrier frequency the same as the LO. Every wideband channel of the NT1066 was set up with the same LPF cutoff frequency (19.4 MHz, code 40) and the AGC was off.
For the L3/L5 band (1190 MHz), everything is great. Cutoff frequencies are roughly the same as the set ones and the filters are symmetrical:
L2 band (1237.5 MHz) is worse, but have a little more patience:
Just look at the L1 band (1590 MHz). Cutoff frequencies are about 5 MHz less than they should be and sidebands have different steepness.
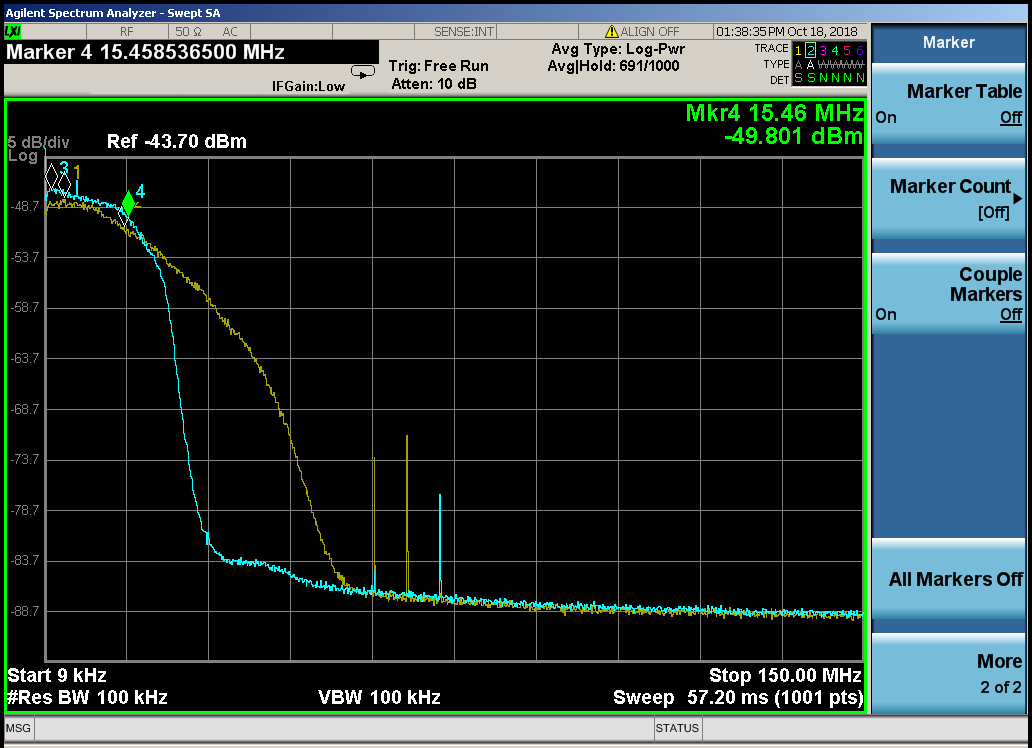
As it was pointed out, the measured frequency response is the combination of the on-chip LPF and the SAW filter. Unfortunately, the MIX_IN input (after the SAW-filter) is not available and the only way to measure the LPF is to modify the board.
Signal processing
Yet another step of evaluating this frontend is checking for the signal processing quality. To make things relatively simple I’ve connected the Trimble antenna to the evaluation board input, IQ output to the Keysight oscilloscope. This allowed me to collect the signal and post-process it. As a reference, I’ve used the NT1065 evaluation board.
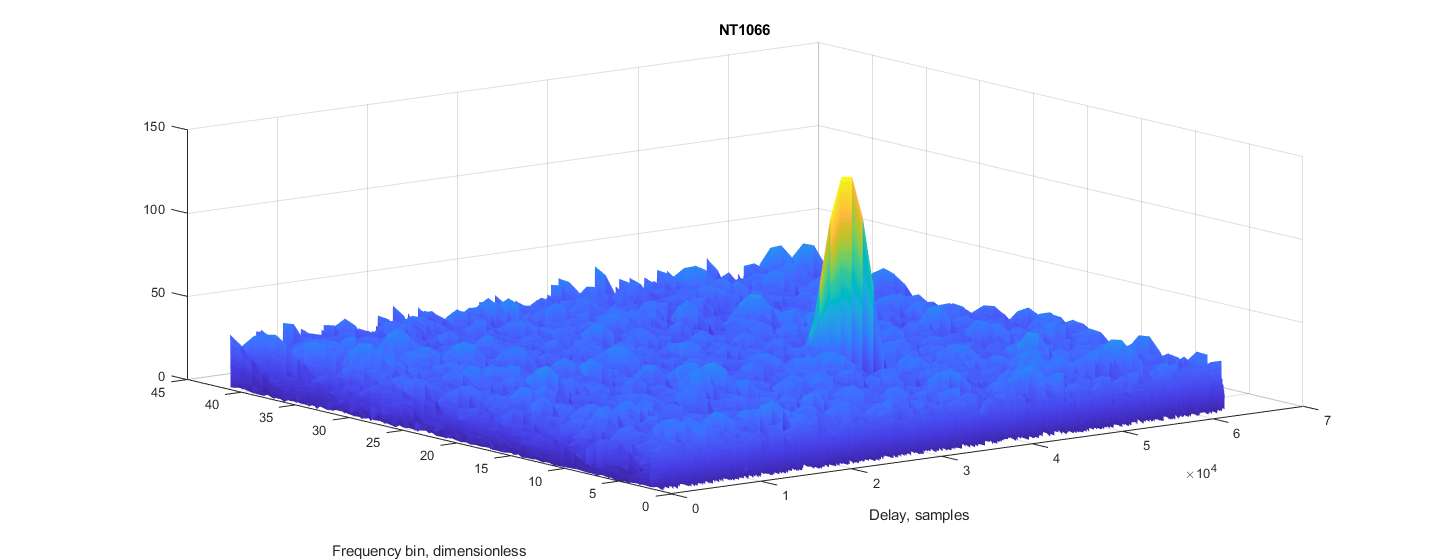
For the collected signal, I performed the acquisition and estimated the SNR. As you may notice, there’s a slight difference in levels of the correlation peaks. It may be the effect of the more powerful amplifiers in the newer frontend.
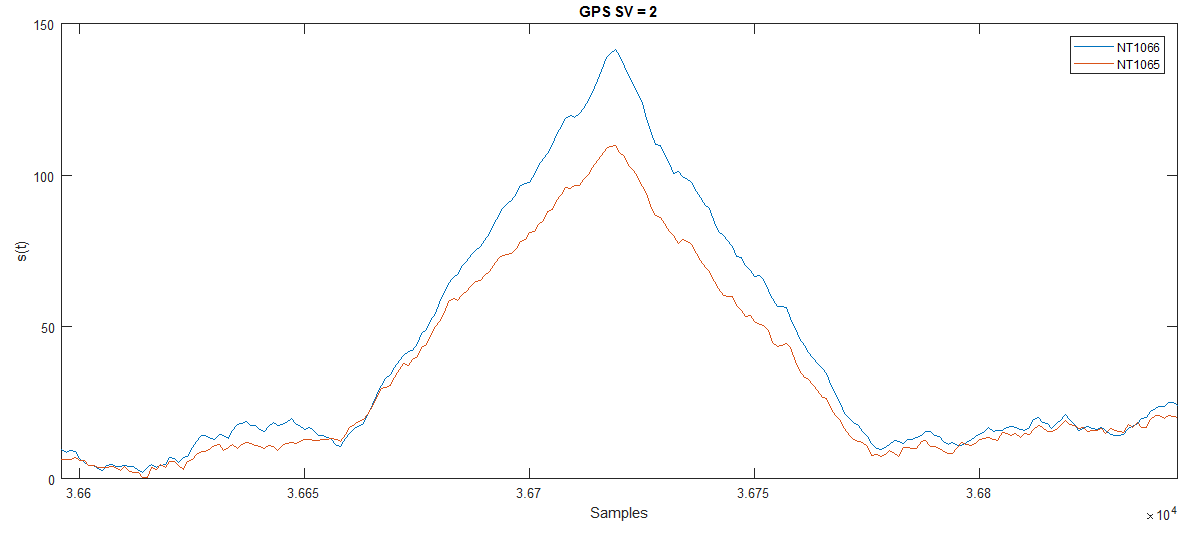
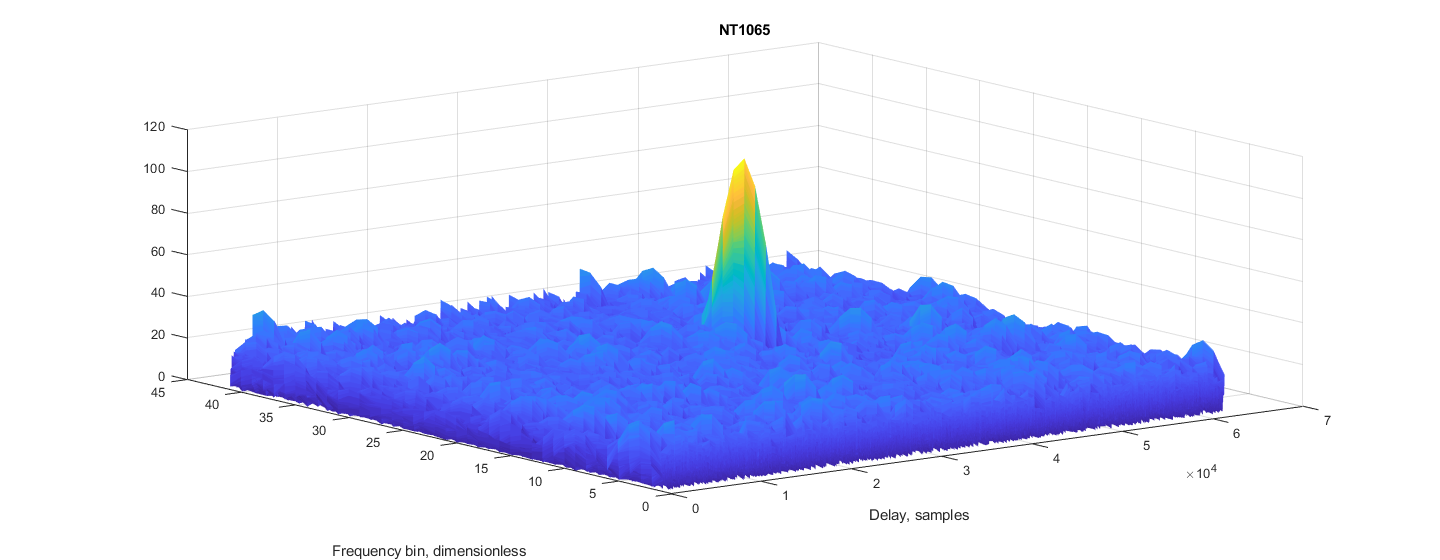
Acquisition plots look very similar; the difference in frequency is due to the pseudo-doppler (the difference between the reference clocks).
And the NT1065:
From the signal processing point of view, the NT1066 is the good and more powerful alternative to the NT1065.
Using in the GNSS receiver
Due to the deeply programmable design of our MC149.01 receiver, I was able to compare the performance of the two frontends: NT1065 in the receiver itself and the NT1066 with the BBP2 evaluation board.
For the experiment, I’ve switched the receiver DLL back to the basic 3-point narrow correlator and we’ll be processing only L1/L2 bands. Standalone mode performs well, both receivers display similar results:
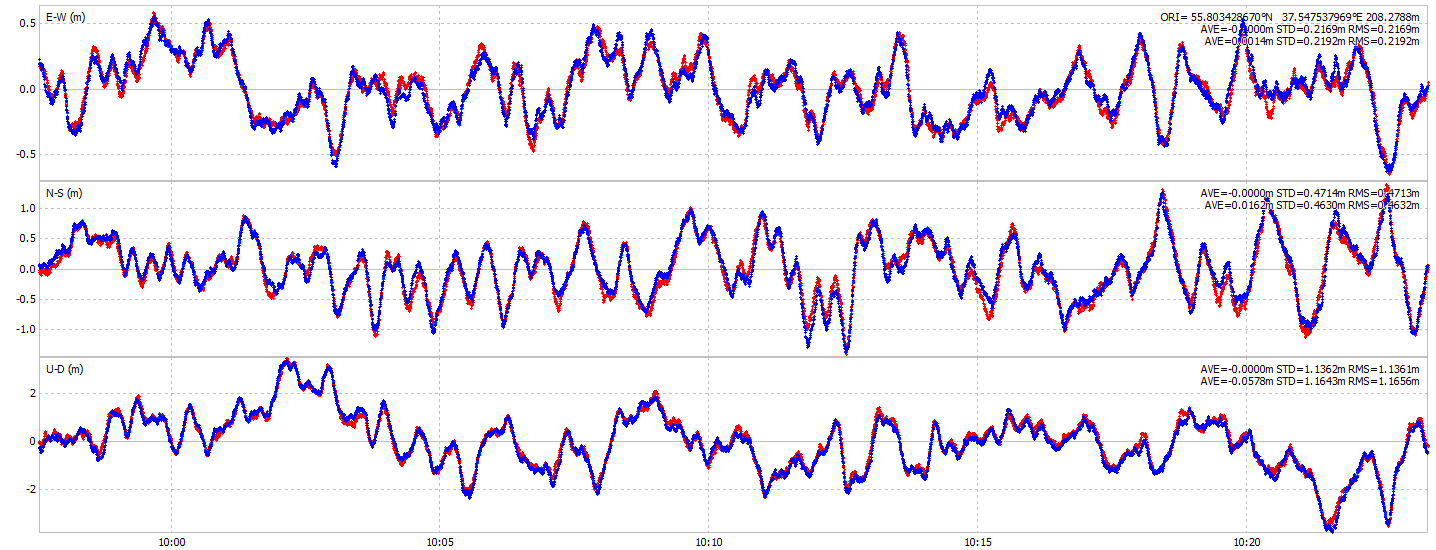
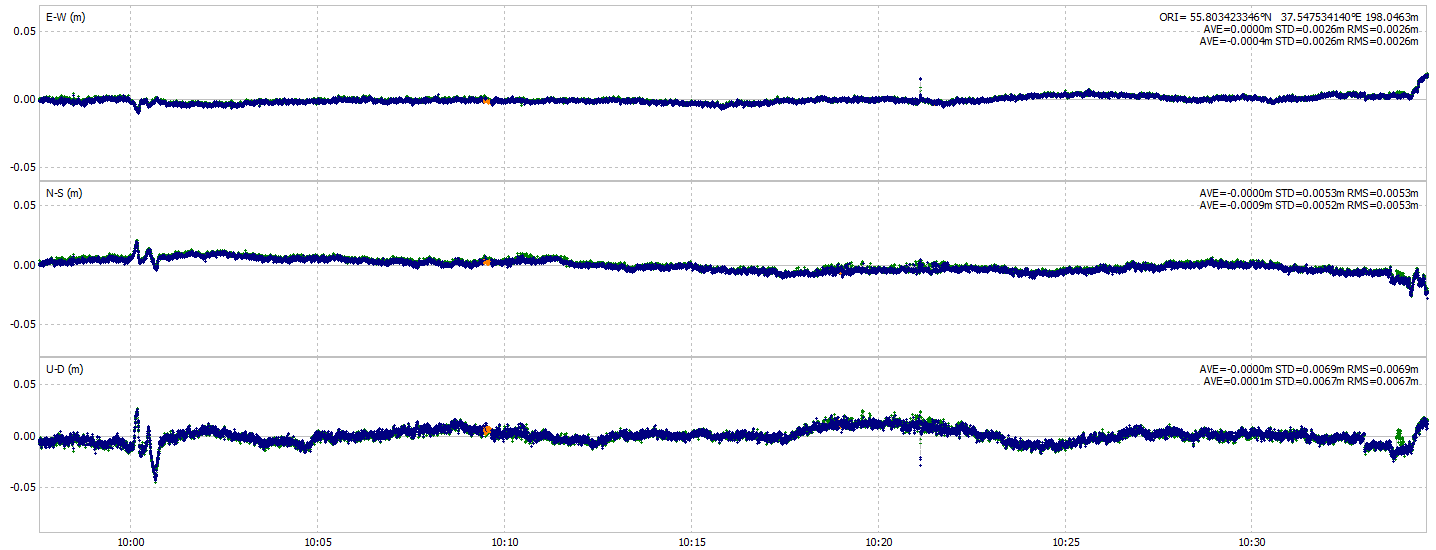
Testing in the RTK mode shows something similar to what I’ve seen with the Piksi Multi receiver. Both footprints look very similar with some constant offset:
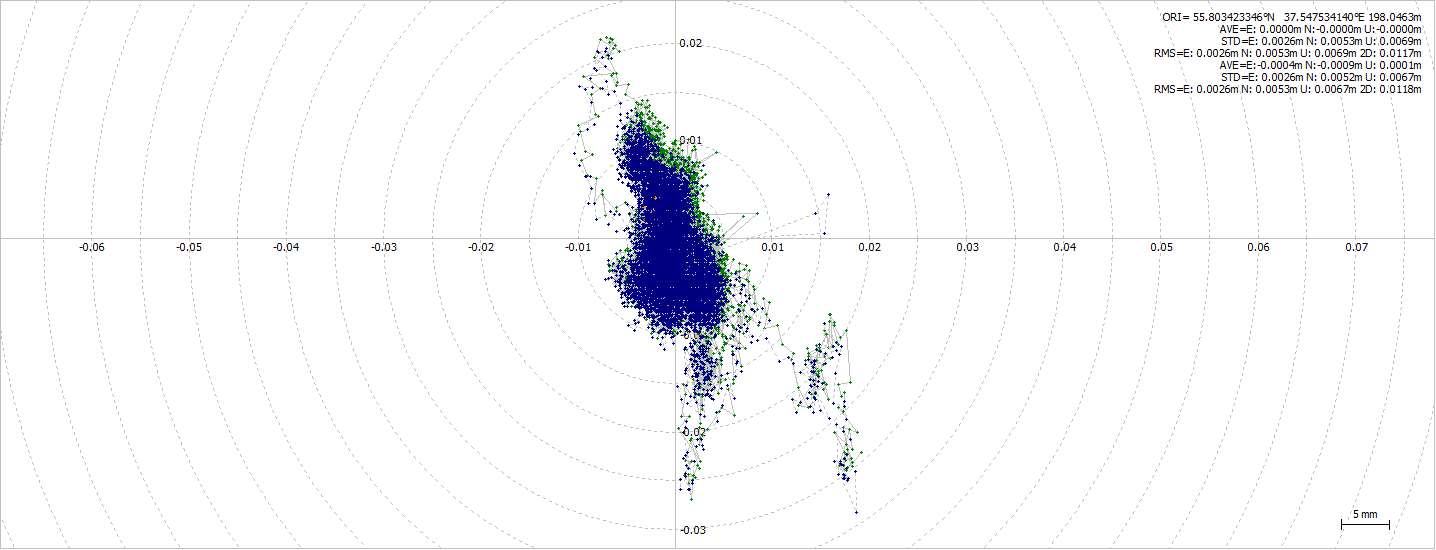
There’s a little wobbly stuff at around 10 AM, which is caused by the base station corrections being outdated.
Conclusion
I’m really happy with the results of the new frontend, despite some minor things. It is extremely great that one might get good results during the first week after he gets the evaluation board. There are still some tests I need to perform, but I’m pretty confident that we’ll be able to modify and shrink our current RF circuit with the help of this chip.
One more thing worth pointing out is that we’ll be seeing much more triple-band receivers in a couple of years. Good job, NTLab!